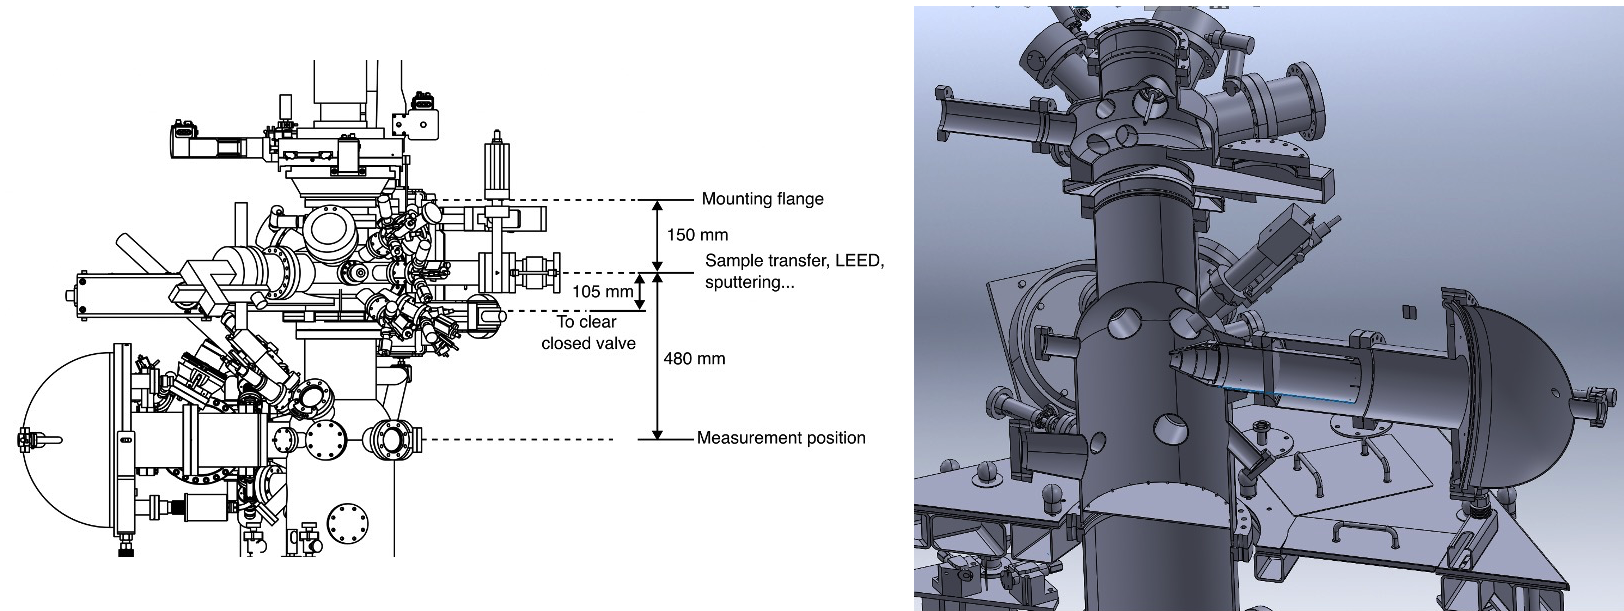
Analysis chamber and control panels
The analysis chamber on the Spin endstation includes a small chamber mounted on the top (‘Prep top’) where samples are transferred and can be cleaved.
Sample camera
The sample camera feed is obtained through the Pylon Viewer software, launched from the desktop. The camera image can be panned (click+drag) or zoomed (ctrl+mousewheel) without losing the crosshair position. (See also the dedicated Basler sample cameras page). The primary chamber lighting is via a Zeiss CL6000 , with intensity manually adjusted by the knob on the front. The most recent verified crosshair position is saved in a txt file in the ControlGUIs folder.
Control GUIs
How to launch control GUIs
For the control panels on the Windows spectrometer control computers, there is a folder on the desktop called ‘ControlGUIs’. Within this you will find all of the control GUIs discussed below. All of them have a corresponding ‘Launch’ shortcut that you can double click on.
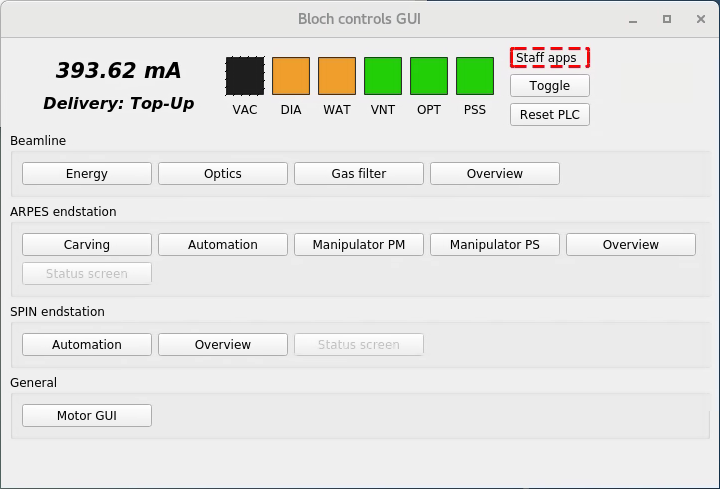
For the control panels on the ‘beamline’ control computer (Linux) there is a ‘Bloch controls GUI’ shortcut on the desktop that brings up a launcher for all the sub-panels.
There is some redundancy between what you can do with the controls on the two different computers. As a general rule, the panels on the Linux computer are more full featured while those on the Windows computer are simplified cover only what you need to perform an experiment. Those who are measuring remotely through a VPN connection can only access the Windows computer.
Manipulator control (Windows computer)
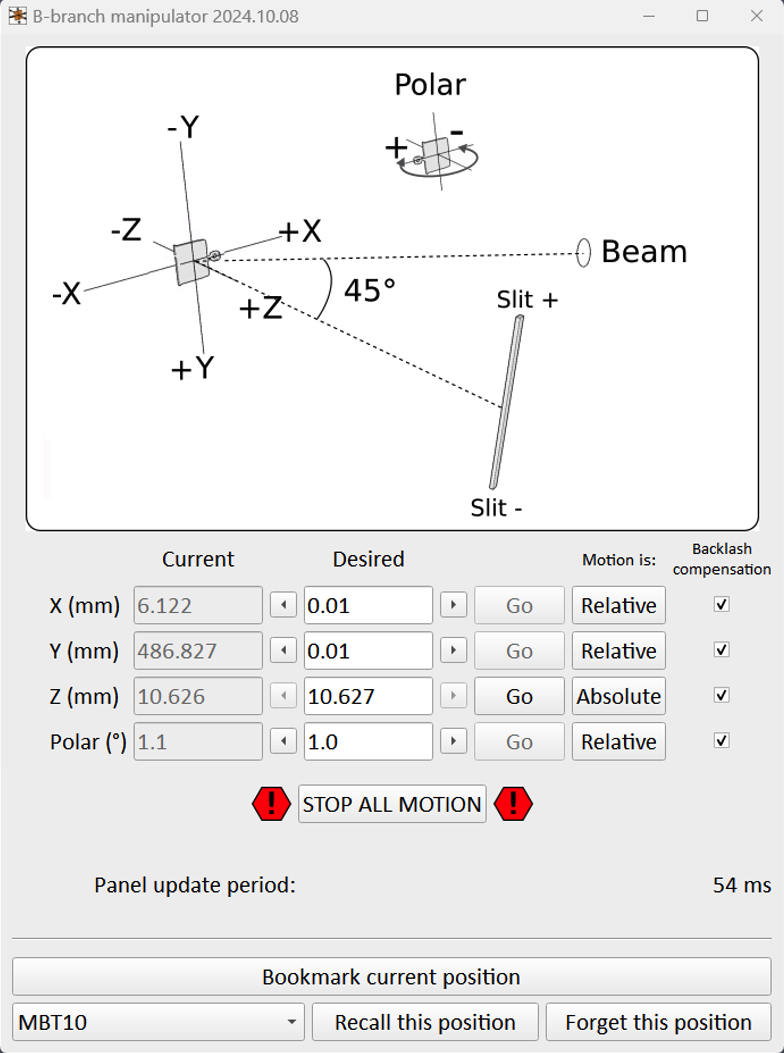
This panel controls the 4.5-axis manipulator motion. Axes can be toggled between relative and absolute motion, and nothing will happen until you click the ‘Go’ button.
Warning
There is, at present, no software or hardware restrictions that would prevent you from driving the manipulator into the analyzer. Until this is put into place, proceed with extreme caution
Warning
Always ensure that both wobblesticks and the cleaving ashtray are retracted before descending to measurement position
You will be using either the z-axis or ‘hv’ axis to bring the sample into focus perpendicular to the slit; start with steps of 0.1 but once you’re approaching the optimal fine tune in steps of 0.02.
If you are scouting around the sample and want to ‘bookmark’ good positions you find, the ‘Save current position’ button will do this. Pressing the ‘recall’ button for a saved position will populate the ‘Desired’ fields for all axes, but nothing will move until you press ‘Go’ for each of these axes one by one.
Going up and down between the measurement and transfer positions is performed using the same macro - key positions are saved as bookmarked positions.
‘Automap’ (Windows computer)
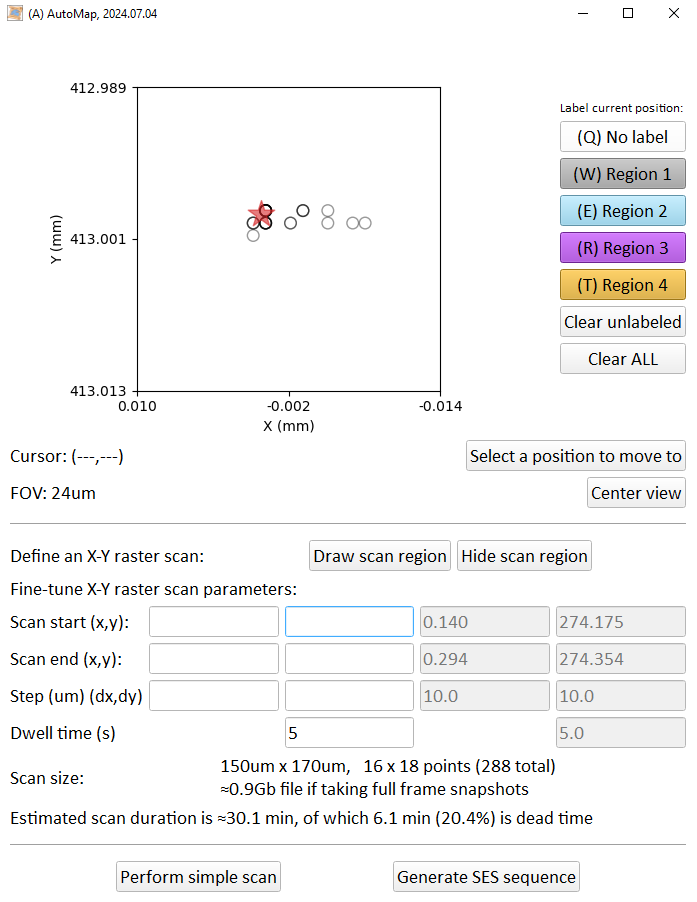
The Manipulator control panel is also keeping a continuous record of every position you have visited, where ‘visited’ means you have stayed there for a few seconds. You can find this record as a plain-text file in the ControlGUIs folder. The Automap panel continuously monitors this record and produces an X-Y ‘birds-eye’ view of your position history. This is useful for visualizing where you have (and have not) been, and the colored buttons on the right allow you to manually label positions of interest.
Red cross: where you are right now
Hollow circle: somewhere you have been
Filled circle: somewhere you have labelled
With the mouse you can pan and zoom the map, and also select a position you would like to move to.
The second facet of this panel is an easier way to perform X-Y raster scan measurements. The bottom section of the panel allows you to draw a region that you would like to scan (click and drag), and then fine tune the position grid by editing step size or start/end positions. You can then either perform the scan directly without recording any spectra to file, OR enter the scan parameters into the xyscanner python script.
Temperature control panel (Windows computer)
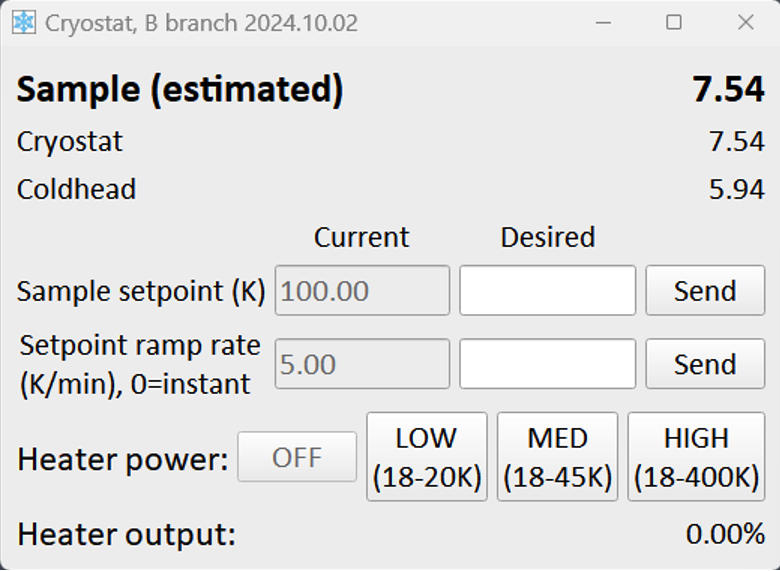
This panel controls the Lakeshore controller, which measures the cryostat temperatures and runs the counter-heater. Inputs here are:
Sample setpoint: What temperature you want to have on the sample. Note that nothing will happen if the heater power is set to ‘OFF’
Ramp rate: How fast the sample setpoint is allowed to change
Heater power: Maximum power the control loop is allowed to give the heater. Each button indicates the temperature range that can be achieved for that setting. It is typical to choose either ‘OFF’ (for base temperature) or ‘HIGH’ (anything else)
Trendplots (Windows computer)
Simple temperature and pressure trendplot panels are available. These will only start plotting data from the time they were launched onwards.
Launcher panel (Linux computer)
From here you launch other panels with specialized functions. As a B-endstation user you do not typically need to interact with them.