Analysis chamber and control panels
Maximum countrate
Excessive countrates will damage the MCP in the detector assembly, and at BLOCH it is very easy to generate unsafe countrates. Respect the following rules:
Maximum 1 million counts/s if everything is in a narrow stripe (for example transmission mode or graphene’s Dirac cone)
Maximum 10 million counts/s if intensity is evenly distributed across the detector
Core levels should be measured in an angular lens mode, except where lens table limits make this impossible.
Warning
There is no background process in SES to monitor countrates, so you must verify that the countrate is safe while in voltage calibration mode. If you will perform an angle scan or photon energy scan, check the intensity over the whole scan range, not just your starting position. If you will measure in swept mode, ensure that the intensity slightly below your starting point is also safe.
If you ever accidentally close the ‘SES Detector Viewer’ window in SES that shows a live stream of the detector, it can be reopened through Installation>Instrument>Dectector Interface>Setup>Filter:Real-time Monitor>Setup…
Sample camera
The sample camera feed is obtained through the Pylon Viewer software, launched from the desktop. The camera image can be panned (click+drag) or zoomed (ctrl+mousewheel) without losing the crosshair position. (See also the dedicated Basler sample cameras page). The primary chamber lighting is via a Zeiss CL6000 , with intensity manually adjusted by the knob on the front. The most recent verified crosshair position is saved in a txt file in the ControlGUIs folder.
Control GUIs
How to launch control GUIs
For the control panels on the Windows spectrometer control computers, there is a folder on the desktop called ‘ControlGUIs’. Within this you will find all of the control GUIs discussed below. All of them have a corresponding ‘Launch’ shortcut that you can double click on.
For the control panels on the ‘beamline’ control computer (Linux) there is a ‘Bloch controls GUI’ shortcut on the desktop that brings up a launcher for all the sub-panels.
There is some redundancy between what you can do with the controls on the two different computers. As a general rule, the panels on the Linux computer are more full featured while those on the Windows computer are simplified cover only what you need to perform an experiment. Those who are measuring remotely through a VPN connection can only access the Windows computer.
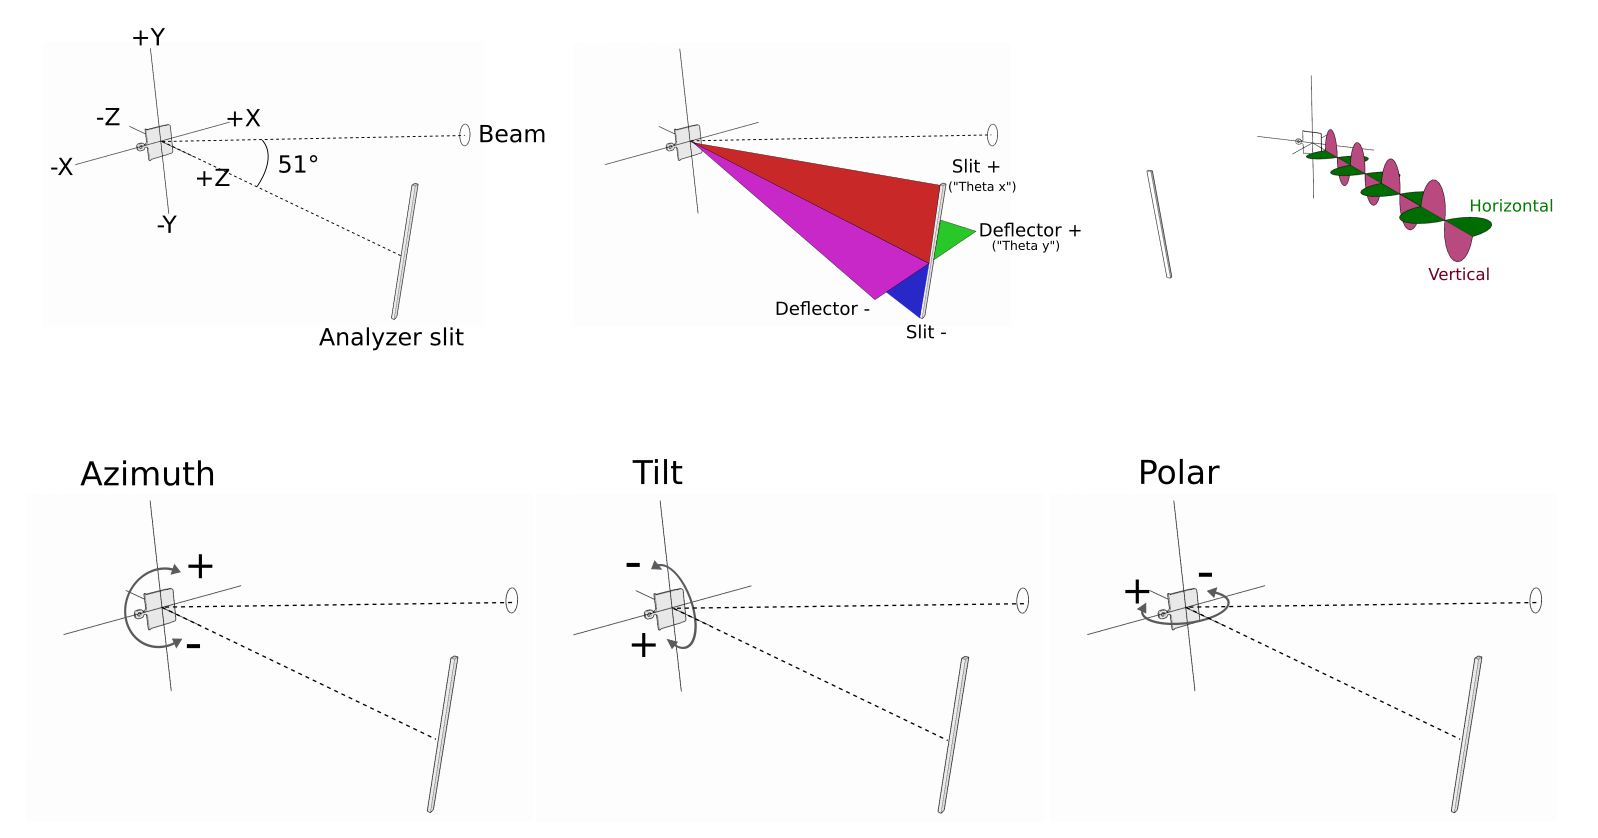
Manipulator control (Windows computer)
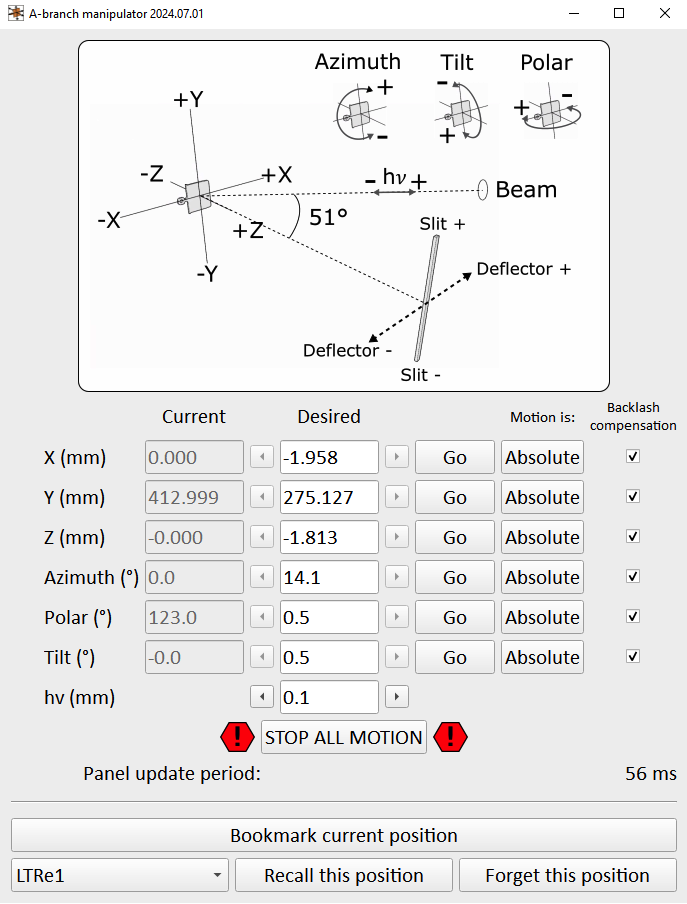
This panel controls the Carving 6-axis manipulator motion. Axes can be toggled between relative and absolute motion, and nothing will happen until you click the ‘Go’ button.
The motion in this interface is software restricted to a safe bounding volume, so in principle it should not be possible to crash the manipulator into anything.
You will be using either the z-axis or ‘hv’ axis to bring the sample into focus perpendicular to the slit; start with steps of 0.1 but once you’re approaching the optimal fine tune in steps of 0.02. Focusing is discussed in more detail on the ‘DA30’ page)
If you are scouting around the sample and want to ‘bookmark’ good positions you find, the ‘Save current position’ button will do this. Pressing the ‘recall’ button for a saved position will populate the ‘Desired’ fields for the 6 axes, but nothing will move until you press ‘Go’ for each of these axes one by one.
You should only need to manually adjust the Carving position when you are measuring - going up and down between the measurement and transfer positions is performed as pre-programmed paths in order to avoid collisions. These motions are currently only possible from the Linux control computer, you cannot do them from the Windows computer.
‘Automap’ (Windows computer)
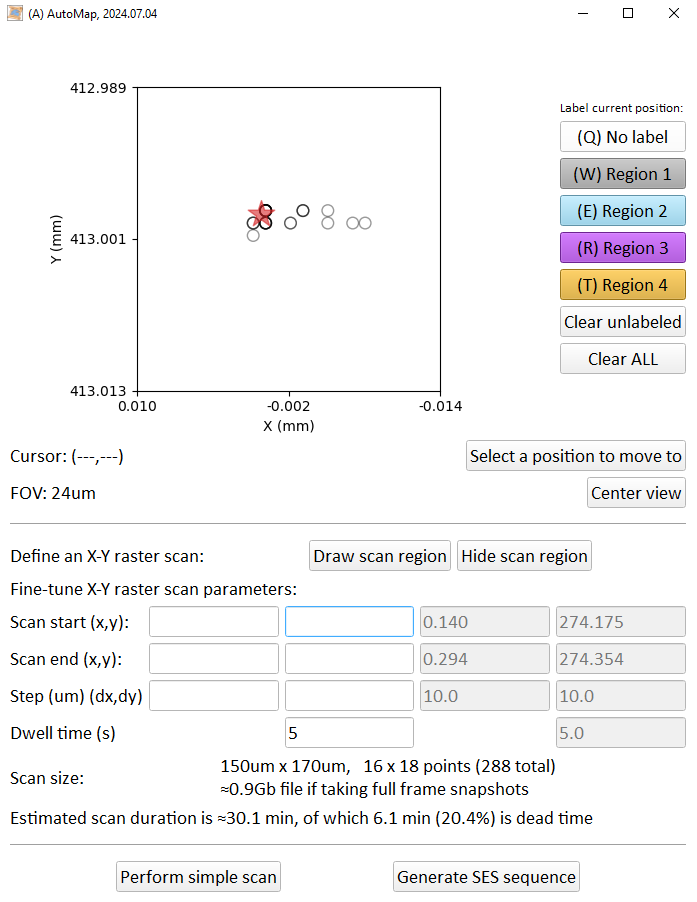
The Manipulator control panel is also keeping a continuous record of every position you have visited, where ‘visited’ means you have stayed there for a few seconds. You can find this record as a plain-text file in the ControlGUIs folder. The Automap panel continuously monitors this record and produces an X-Y ‘birds-eye’ view of your position history. This is useful for visualizing where you have (and have not) been, and the colored buttons on the right allow you to manually label positions of interest.
Red cross: where you are right now
Hollow circle: somewhere you have been
Filled circle: somewhere you have labelled
With the mouse you can pan and zoom the map, and also select a position you would like to move to.
The second facet of this panel is an easier way to perform X-Y raster scan measurements. The bottom section of the panel allows you to draw a region that you would like to scan (click and drag), and then fine tune the position grid by editing step size or start/end positions. You can then either perform the scan directly without recording any spectra to file, OR generate a valid SES sequence containing a pre-defined manipulator scan region. This is a vastly easier way to set up spatial maps in SES compared to the native interface.
Temperature control panel (Windows computer)
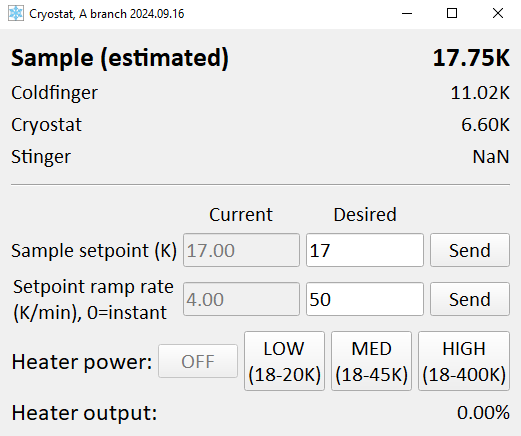
This panel controls the Lakeshore controller, which measures the cryostat temperatures and runs the counter-heater. See the detailed discussion on the ‘Carving’ page for information on how to interpret the temperatures shown here. Inputs here are:
Sample setpoint: What temperature you want to have on the sample. Note that nothing will happen if the heater power is set to ‘OFF’
Ramp rate: How fast the sample setpoint is allowed to change
Heater power: Maximum power the control loop is allowed to give the heater. Each button indicates the temperature range that can be achieved for that setting. It is typical to choose either ‘OFF’ (for base temperature) or ‘HIGH’ (anything else)
Trendplots (Windows computer)
Simple temperature and pressure trendplot panels are available. These will only start plotting data from the time they were launched onwards.
Launcher panel (Linux computer)
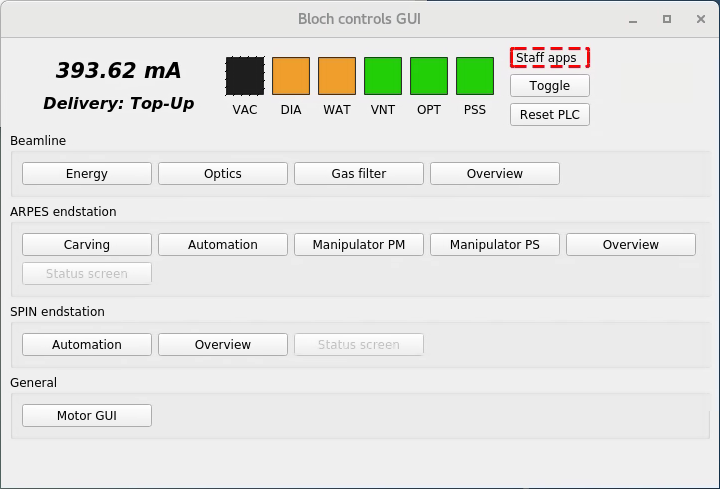
From here you launch other panels with specialized functions. As a user you will be mostly interacting with the ‘Carving’ (manipulator control) and ‘Energy’ (beamline control) panels.
Carving panel (Linux computer)
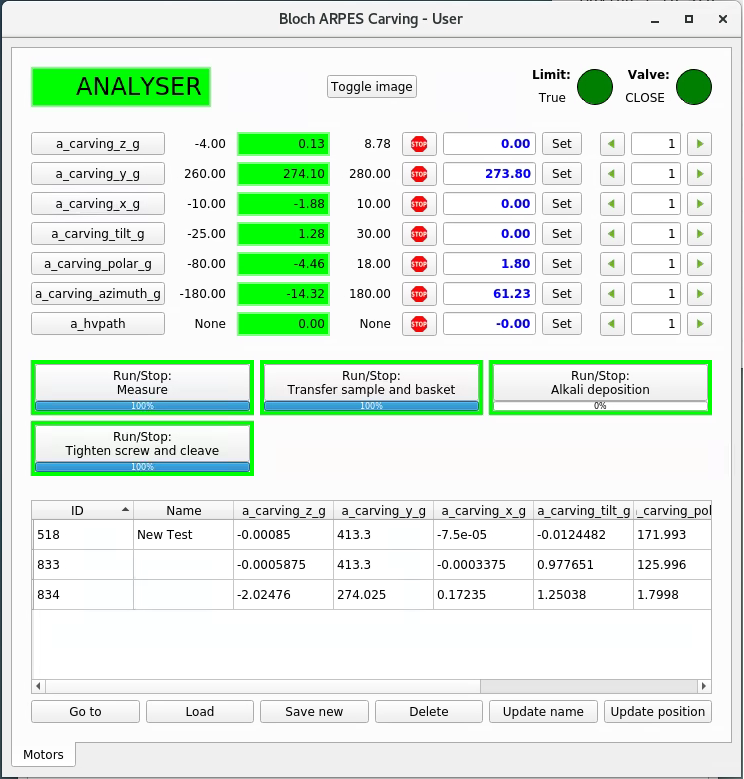
Similar to the ‘Manipulator control’ on the Windows computer, except now you have some additional buttons to initiate movement between the major positions. These are:
Measure |
Put the sample in front of the analyzer |
Transfer sample and basket |
Pick up samples from the transfer arm and insert them into the manipulator |
Alkali deposition |
Place the sample in front of the alkali source (see Alkali deposition page) |
Tighten screw and cleave |
Tighten/loosen the two clamping screws on the manipulator, and/or cleave a sample |
There are two indicators in the top right of this panel. Both must be green before the movement buttons will work. ‘Valve’ means the gate valve to the transfer chamber (which must be closed). ‘Limit’ means the manipulator position is somewhere abnormal and needs to be manually moved back into a predefined bounding volume. Beamline staff can help you with this.
Warning
Always retract both wobblesticks fully after you have used them. If they are left pushed into the chamber, the manipulator can catch on them and cause major damage when it moves between positions.